Making slice plots (Beginner)
Import packages
[1]:
import numpy                          as np
import matplotlib.pyplot              as plt
import os

# importing plons modules
import plons
import plons.SmoothingKernelScript    as sk
import plons.ConversionFactors_cgs    as cgs
import plons.Plotting                 as plot
Setting information about data
[2]:
prefix = "wind"
loc = "Model"
dumpnumber = 600
dump = os.path.join(loc, f"{prefix}_{dumpnumber:06d}")
Retrieving the data
Creating the directory to store the models
[3]:
!mkdir -p $loc
Downloading the data
[4]:
%%capture
if not os.path.exists(dump):
    !wget "https://github.com/Ensor-code/phantom-models/raw/refs/heads/main/Esseldeurs+2023/BinaryHighLucy/wind_00600?download=" --output-document $dump
infile = os.path.join(loc, f"{prefix}.in")
if not os.path.exists(infile):
    !wget "https://raw.githubusercontent.com/Ensor-code/phantom-models/refs/heads/main/Esseldeurs%2B2023/BinaryHighLucy/wind.in" --output-document $infile
setupfile = os.path.join(loc, f"{prefix}.setup")
if not os.path.exists(setupfile):
    !wget "https://raw.githubusercontent.com/Ensor-code/phantom-models/refs/heads/main/Esseldeurs%2B2023/BinaryHighLucy/wind.setup" --output-document $setupfile
Loading setup and dump
[5]:
setup = plons.LoadSetup(loc, prefix)
[6]:
dumpData = plons.LoadFullDump(dump, setup)
Plotting density in the orbital plane
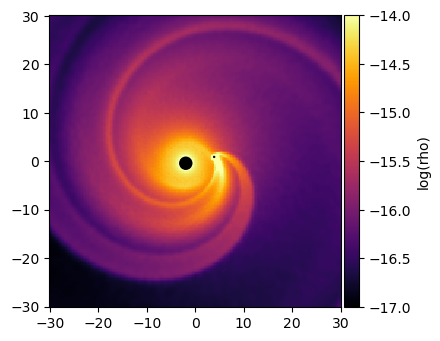
Plotting around the CoM
[7]:
fig, ax = plt.subplots(1, figsize=(4, 4))
cbar = plot.SlicePlot2D(ax, dumpData, setup, xlim=(-30, 30), ylim=(-30, 30))

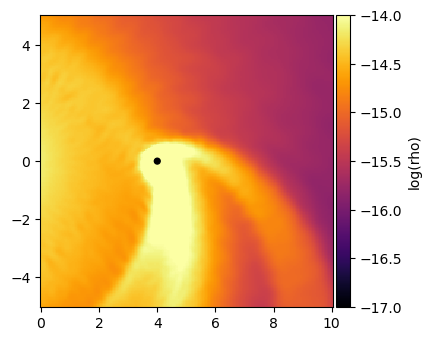
Plotting around the companion
[8]:
fig, ax = plt.subplots(1, figsize=(4, 4))
cbar = plot.SlicePlot2D(ax, dumpData, setup, xlim=(0, 10), ylim=(-5, 5), rotate=True)
Making your own plane on which to smooth (as a meshgrid)
[9]:
n = 200
x = np.linspace(-30, 30, n)*cgs.au
y = np.linspace(-30, 30, n)*cgs.au
X, Y = np.meshgrid(x, y)
Z    = np.zeros_like(X)
Smoothing the data on the plane
[10]:
smooth = sk.smoothMesh(X, Y, Z, dumpData, ['rho'])
Plotting the plane
[11]:
fig, ax = plt.subplots(1, figsize=(4, 4))
plot.plotSlice(ax, X, Y, smooth, 'rho', logplot=True, cmap = plt.colormaps['inferno'], clim=(-17, -14))
cAGB, cComp = plot.plotSink(ax, dumpData, setup)
[12]:
fig, ax = plt.subplots(1, figsize=(4, 4))
plot.plotSlice(ax, X, Y, smooth, 'rho', logplot=True, cmap = plt.colormaps['inferno'], clim=(-17, -14))
cAGB, cComp = plot.plotSink(ax, dumpData, setup)
