Making line plots
Import packages
[1]:
import numpy                          as np
import matplotlib.pyplot              as plt

# import plons scripts
import plons
import plons.SmoothingKernelScript    as sk
import plons.PhysicalQuantities       as pq
import plons.ConversionFactors_cgs    as cgs
Setting information about data
[2]:
prefix = "wind"
loc = "/STER/matse/Papers/Esseldeurs+2023/Phantom/High/binary6Lucy/"
outputloc = "."
dump = loc+"wind_00600"
Loading setup and dump
[3]:
setup = plons.LoadSetup(loc, prefix)
[4]:
dumpData = plons.LoadFullDump(dump, setup)
Making x and z lines on which to smooth
[5]:
n = 200
rx = np.array((np.linspace(-150, 150, n), np.zeros(n), np.zeros(n))).transpose()*cgs.au
theta = pq.getPolarAngleCompanion(dumpData['posComp'][0], dumpData['posComp'][1])
rz = np.array((np.zeros(n), np.zeros(n), np.linspace(-150, 150, n))).transpose()*cgs.au
Smoothing the data on the lines
[6]:
smoothx = sk.getSmoothingKernelledPix(100, dumpData, ['rho'], sk.rotatePixCoordAroundZ(theta, rx))
smoothz = sk.getSmoothingKernelledPix(100, dumpData, ['rho'], rz)
Plotting the lines
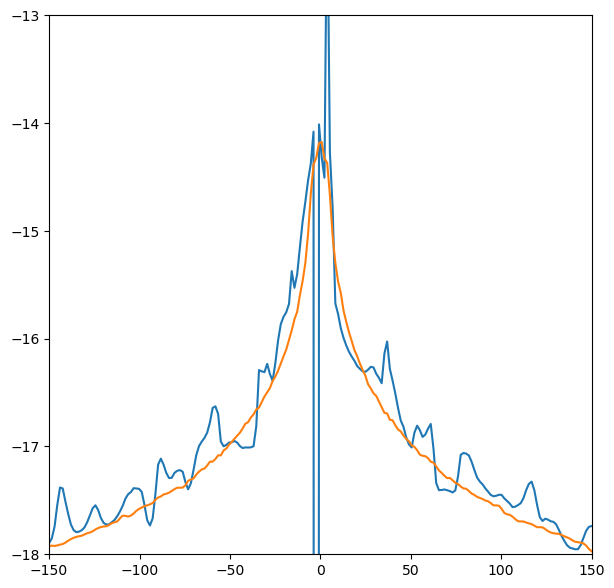
[7]:
fig, ax = plt.subplots(1, figsize=(7, 7))

ax.plot(rx[:,0]/cgs.au, np.log10(smoothx["rho"]+1e-99))
ax.plot(rz[:,2]/cgs.au, np.log10(smoothz["rho"]+1e-99))
ax.set_xlim(-150, 150)
ax.set_ylim(-18, -13)

plt.show()