Making slice plots (Beginner)
Import packages
[1]:
import numpy                          as np
import matplotlib.pyplot              as plt

# import plons scripts
import plons
import plons.SmoothingKernelScript    as sk
import plons.ConversionFactors_cgs    as cgs
import plons.Plotting                 as plot
Setting information about data
[2]:
prefix = "wind"
loc = "/STER/matse/Papers/Esseldeurs+2023/Phantom/High/binary6Lucy/"
dump = loc+"wind_00600"
Loading setup and dump
[3]:
setup = plons.LoadSetup(loc, prefix)
[4]:
dumpData = plons.LoadFullDump(dump, setup)
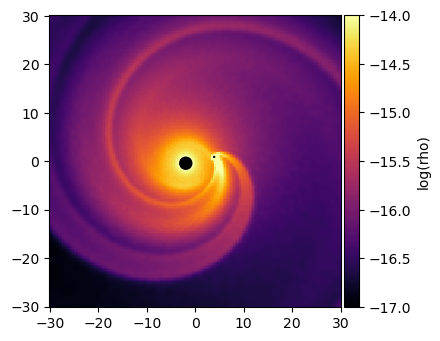
Plotting density in the orbital plane
Plotting around the CoM
[5]:
fig, ax = plt.subplots(1, figsize=(4, 4))
cbar = plot.SlicePlot2D(ax, dumpData, setup, xlim=(-30, 30), ylim=(-30, 30))

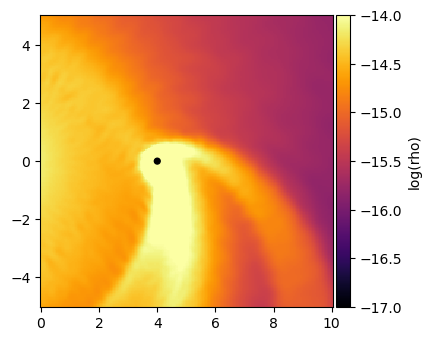
Plotting around the companion
[6]:
fig, ax = plt.subplots(1, figsize=(4, 4))
cbar = plot.SlicePlot2D(ax, dumpData, setup, xlim=(0, 10), ylim=(-5, 5), rotate=True)
Making your own plane on which to smooth (as a meshgrid)
[7]:
n = 200
x = np.linspace(-30, 30, n)*cgs.au
y = np.linspace(-30, 30, n)*cgs.au
X, Y = np.meshgrid(x, y)
Z    = np.zeros_like(X)
Smoothing the data on the plane
[8]:
smooth = sk.smoothMesh(X, Y, Z, dumpData, ['rho'])
Plotting the plane
[9]:
fig, ax = plt.subplots(1, figsize=(4, 4))
plot.plotSlice(ax, X, Y, smooth, 'rho', logplot=True, cmap = plt.cm.get_cmap('inferno'), clim=(-17, -14))
cAGB, cComp = plot.plotSink(ax, dumpData, setup)