plot HRM using plons
[2]:
import plons
import os
import numpy as np
import matplotlib.pyplot        as plt

import plons.ConversionFactors_cgs        as cgs
import plons.AccrDisk                     as ad
[8]:
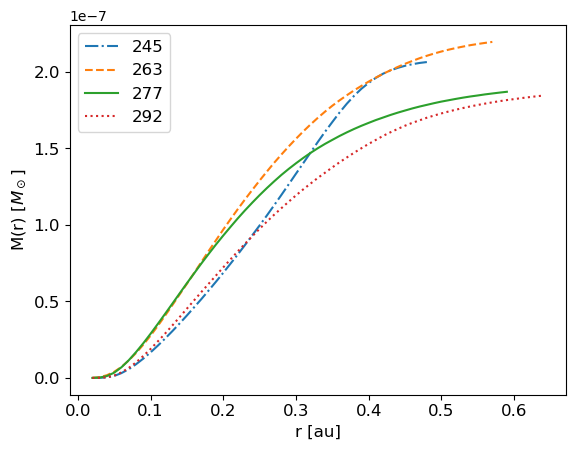
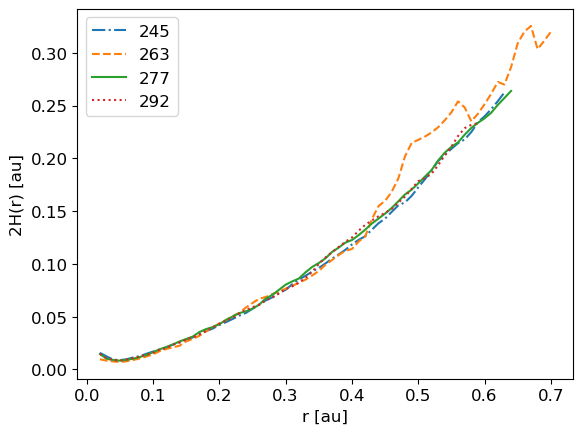
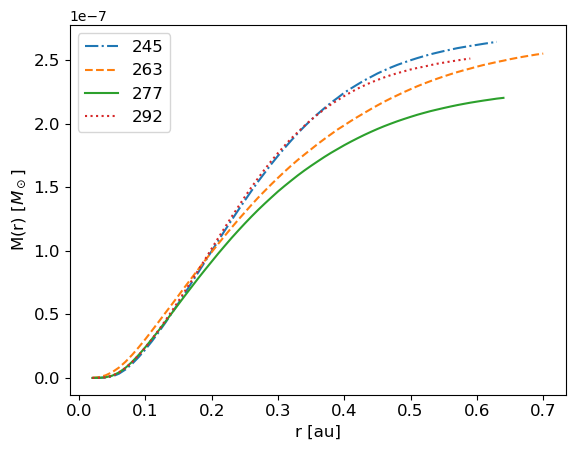
'''
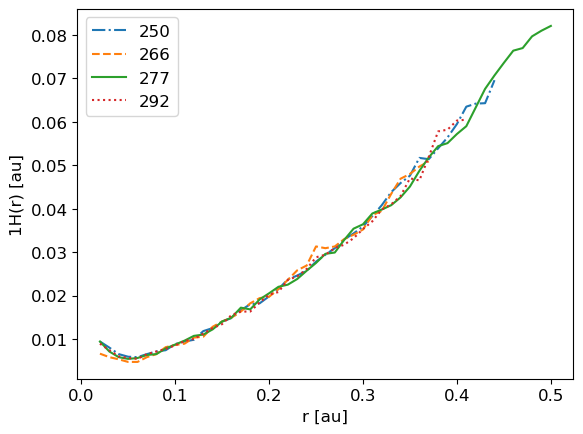
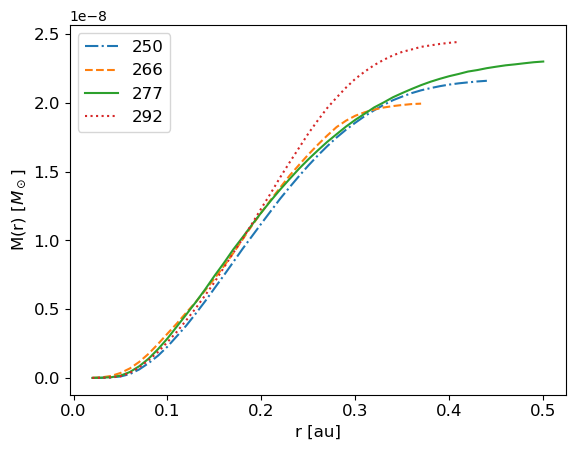
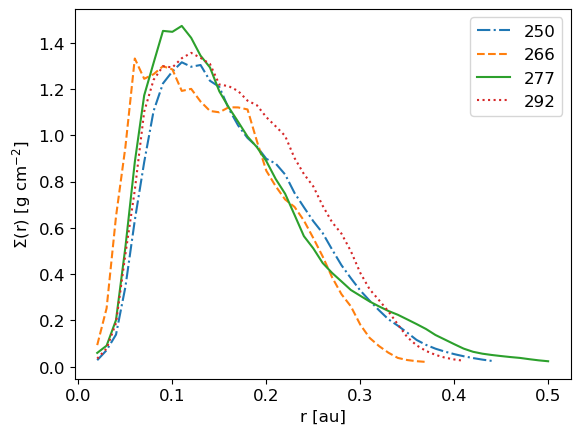
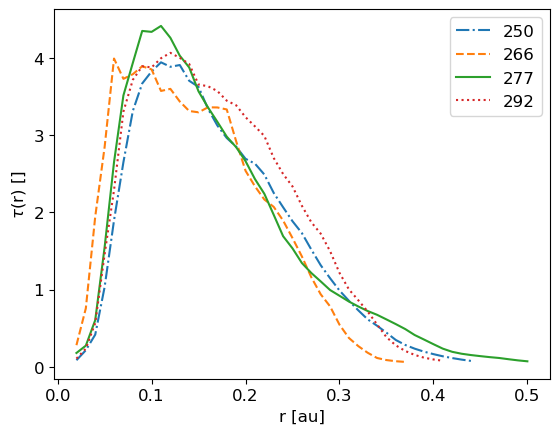
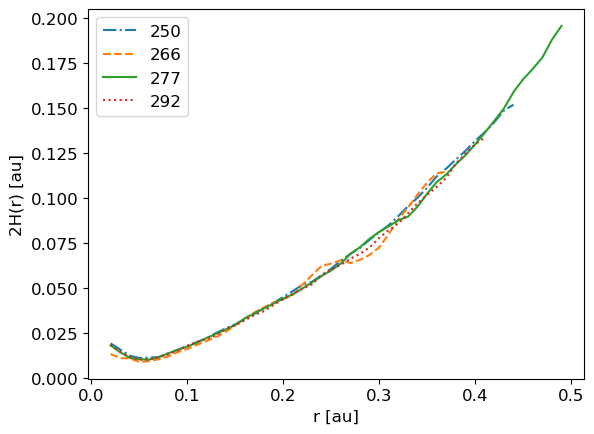
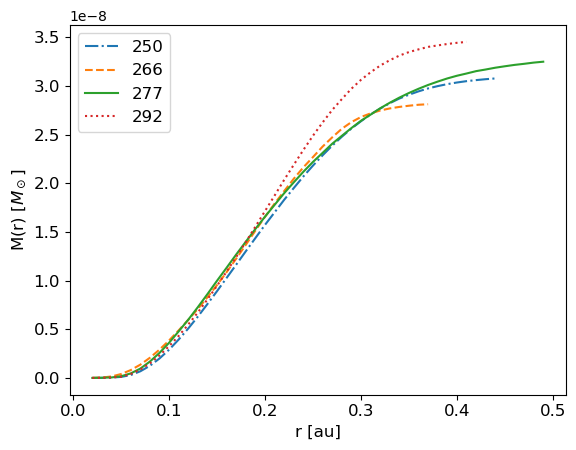
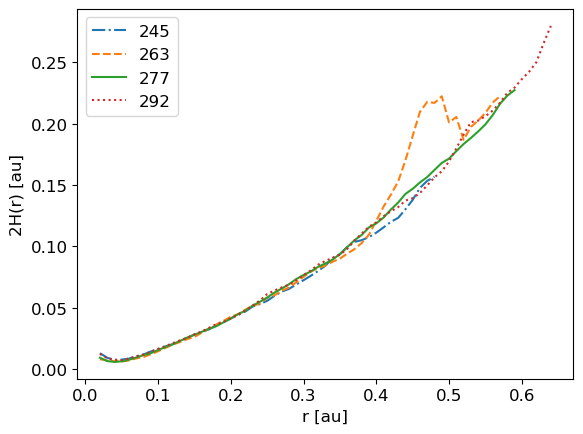
Plot of scale heights and total mass ifo r for 1 model, different dumps
'''
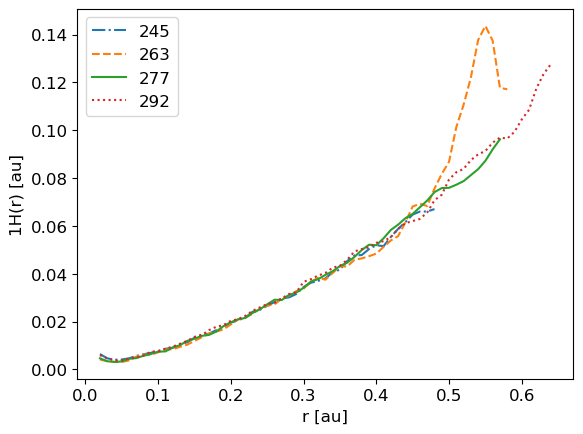
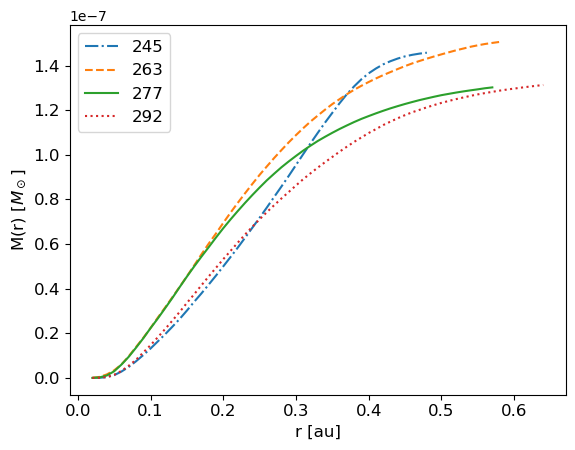
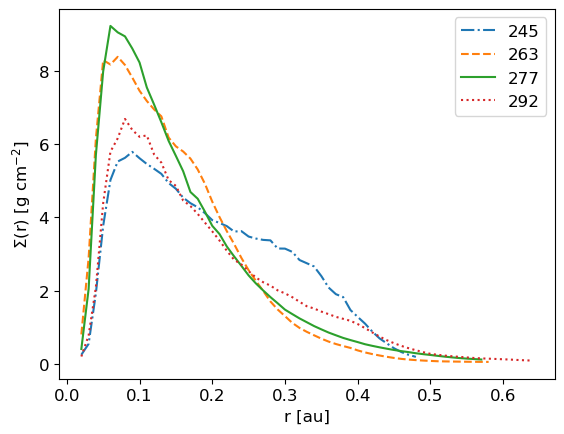
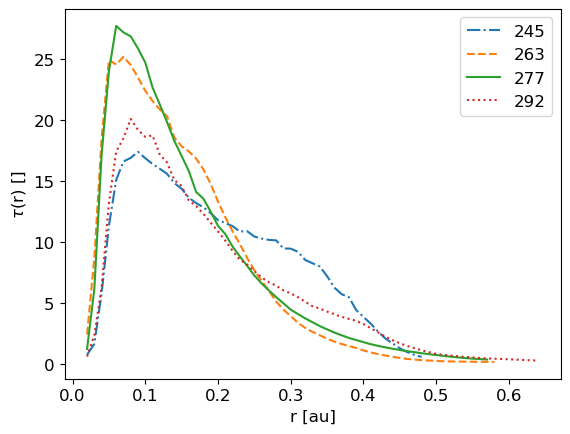
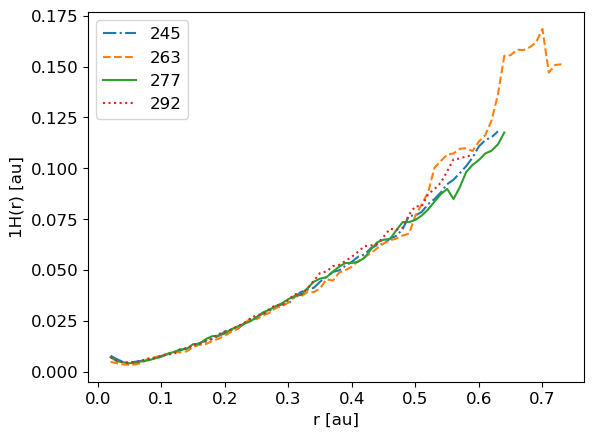
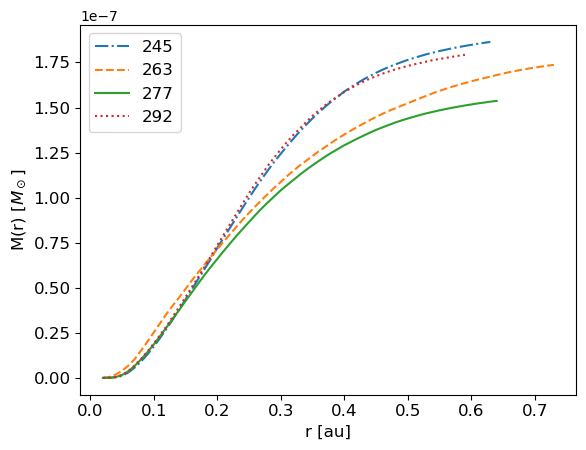
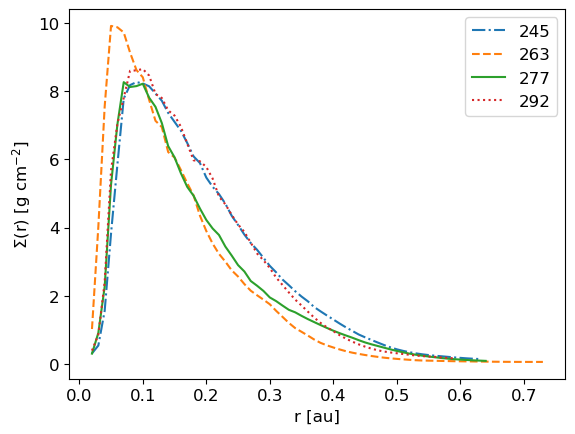
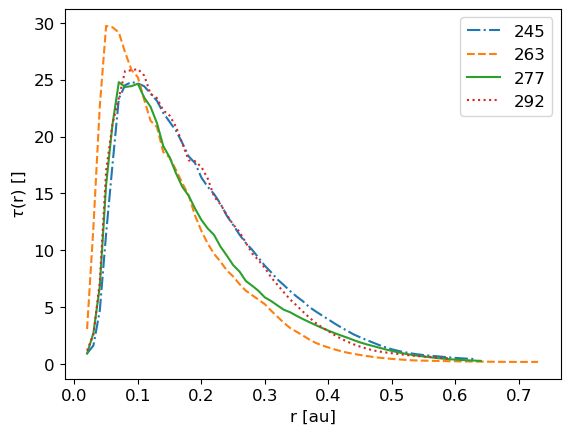
def plotHM_diffDumps(model,dumps,xH):
run = '/lhome/jolienm/Documents/TierModels/R_Aql/cooling/binariesInPaper/finalAccrDisks/'+str(model)+'_T3000_res8_racc01/'
fig1, ax1 = plt.subplots()
fig2, ax2 = plt.subplots()
if xH == '1H':
fig3, ax3 = plt.subplots()
fig4, ax4 = plt.subplots()
fig5, ax5 = plt.subplots()
lineStyles = ['-.','--','-',':']
i = 0
for dump in dumps:
# For all dumps, read in info about r, scale heights, mass
(r,SH,RhoMax,Mtot,MrelRstep,Sigma,SigmaT,tau,tauT) = ad.readInfoAccrDisk(run,dump,xH)
ax1.plot(r[1:],(SH[1:]),linestyle = lineStyles[i],label=str(dump))#,c = CB_color_cycle[2*i+1])
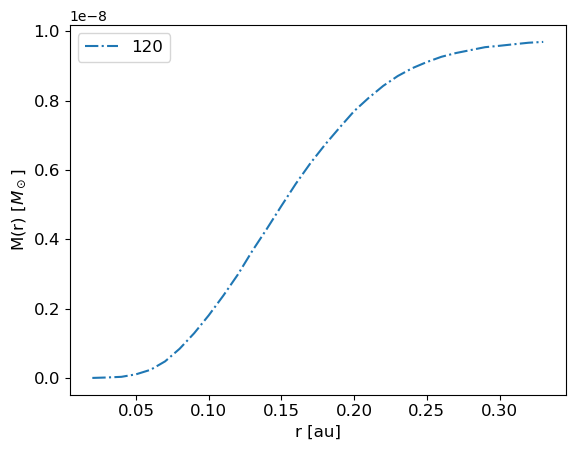
ax2.plot(r[1:],(Mtot[1:]),linestyle = lineStyles[i],label=str(dump))#,c = CB_color_cycle[2*i+1])
if xH == '1H':
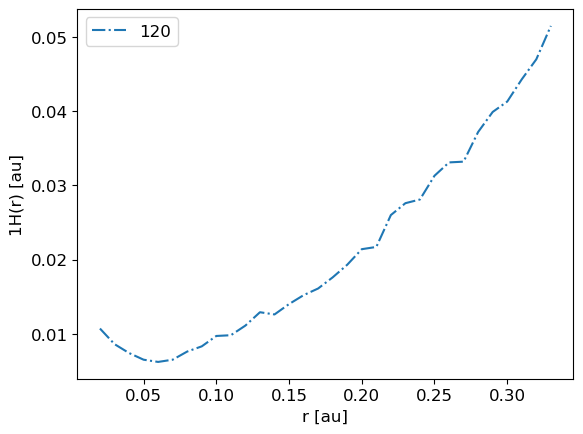
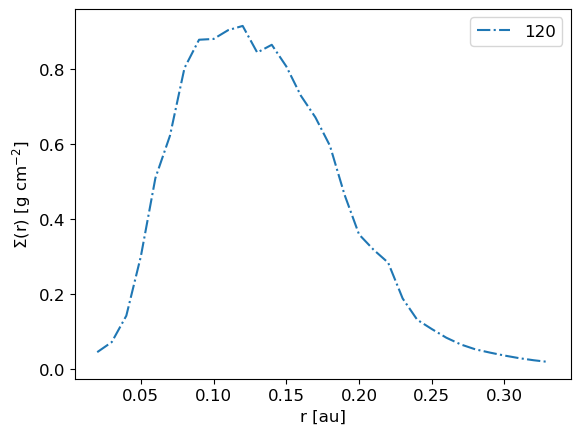
ax3.plot(r[1:],(Sigma[1:]),linestyle = lineStyles[i],label=str(dump))#,c = CB_color_cycle[2*i+1])
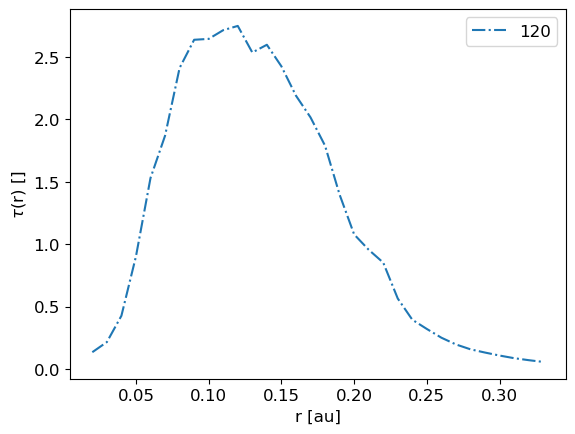
ax4.plot(r[1:],(tau[1:]),linestyle = lineStyles[i],label=str(dump))#,c = CB_color_cycle[2*i+1])
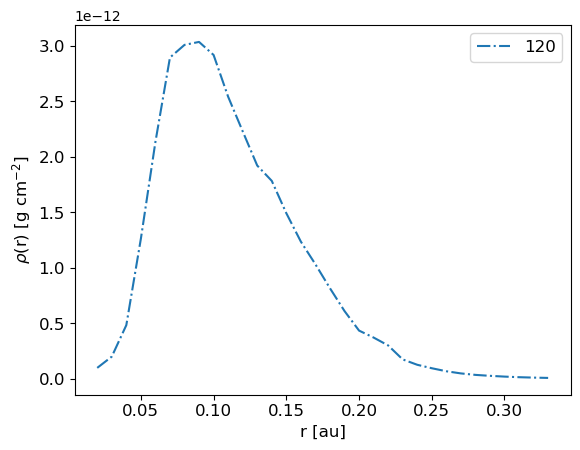
ax5.plot(r[1:],RhoMax[1:],linestyle = lineStyles[i],label=str(dump))
i = i+1
# Construct plots
ax1.legend(fontsize = 12)
ax1.set_xlabel(r'r [au]',fontsize = 12)
ax1.set_ylabel(xH+r'(r) [au]',fontsize = 12,rotation = 90)
ax1.tick_params(axis='x', labelsize=12)
ax1.tick_params(axis='y', labelsize=12)
ax2.legend(fontsize = 12)
ax2.set_xlabel(r'r [au]',fontsize = 12)
ax2.set_ylabel(r'M(r) [$M_\odot$]',fontsize = 12,rotation = 90)
ax2.tick_params(axis='x', labelsize=12)
ax2.tick_params(axis='y', labelsize=12)
fig1.savefig(run+'/plotsAnalysis/diffDumps_SHvsR_'+xH+'.png')
fig2.savefig(run+'/plotsAnalysis/diffDumps_MvsR_'+xH+'.png')
if xH == '1H':
ax3.legend(fontsize = 12)
ax3.set_xlabel(r'r [au]',fontsize = 12)
ax3.set_ylabel(r'$\Sigma$(r) [g cm$^{-2}$]',fontsize = 12,rotation = 90)
ax3.tick_params(axis='x', labelsize=12)
ax3.tick_params(axis='y', labelsize=12)
ax4.legend(fontsize = 12)
ax4.set_xlabel(r'r [au]',fontsize = 12)
ax4.set_ylabel(r'$\tau$(r) []',fontsize = 12,rotation = 90)
ax4.tick_params(axis='x', labelsize=12)
ax4.tick_params(axis='y', labelsize=12)
ax5.legend(fontsize = 12)
ax5.set_xlabel(r'r [au]',fontsize = 12)
ax5.set_ylabel(r'$\rho$(r) [g cm$^{-2}$]',fontsize = 12,rotation = 90)
ax5.tick_params(axis='x', labelsize=12)
ax5.tick_params(axis='y', labelsize=12)
fig3.savefig(run+'/plotsAnalysis/diffDumps_SigmavsR_'+xH+'.png')
fig4.savefig(run+'/plotsAnalysis/diffDumps_TauvsR_'+xH+'.png')
fig5.savefig(run+'/plotsAnalysis/diffDumps_RhoMaxvsR_'+xH+'.png')
[3]:
'''
Plot of scale heights, total mass and relative added mass ifo r for 3 different models, same dump
'''
def plotHMrM_3models(modelNames,dump,xH):
fig1, ax1 = plt.subplots()
fig2, ax2 = plt.subplots()
fig3, ax3 = plt.subplots()
fig4, ax4 = plt.subplots()
if xH == '1H':
fig5, ax5 = plt.subplots()
fig6, ax6 = plt.subplots()
lineStyles = ['-.','--',':','-','-']
SHmaxi = []
Mtmaxi = []
radii = []
colors = ['firebrick','goldenrod','navy']
i = 0
maxX = 0
# Read in info about r, scale heights, masses and relative added mas
for model in modelNames:
run = '/lhome/jolienm/Documents/TierModels/R_Aql/cooling/binariesInPaper/finalAccrDisks/'+str(model)+'_T3000_res8_racc01/'
(r,SH,RhoMax,Mtot,MrelRstep,Sigma,SigmaT,tau,tauT) = ad.readInfoAccrDisk(run,dump,xH)
ax1.plot(r[1:],(SH[1:]),linestyle = lineStyles[i],c = colors[i],label=str(model))#,c = CB_color_cycle[2*i+1])
ax2.plot(r[1:],(Mtot[1:]),linestyle = lineStyles[i],c = colors[i], label=str(model))#,c = CB_color_cycle[2*i+1])
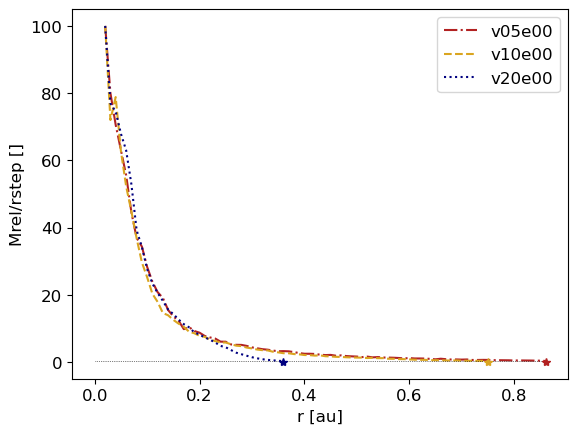
ax3.plot(r[1:],(MrelRstep[1:]),linestyle = lineStyles[i],c = colors[i], label=str(model))#,c = CB_color_cycle[2*i+1])
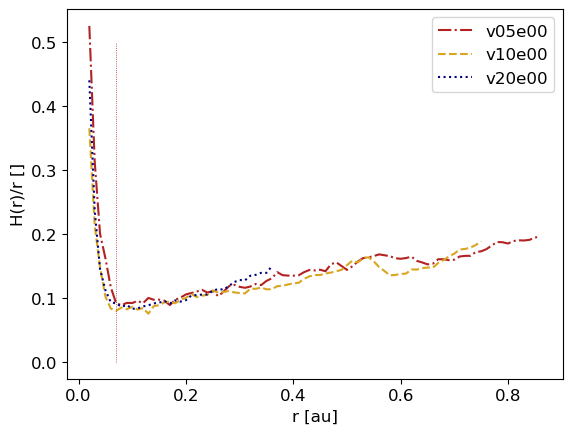
ax4.plot(r[1:],(SH[1:]/r[1:]),linestyle = lineStyles[i],c = colors[i],label=str(model))#,c = CB_color_cycle[2*i+1])
if xH == '1H':
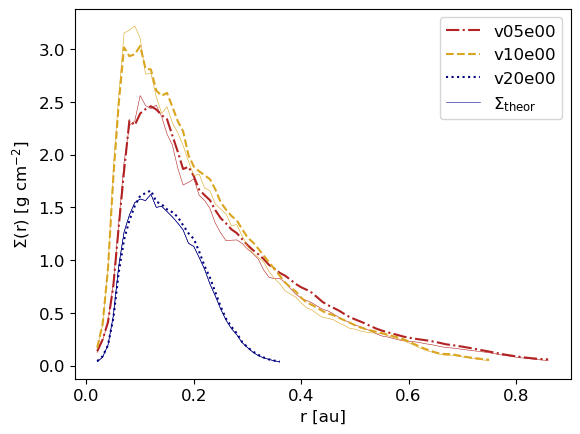
ax5.plot(r[1:],Sigma[1:],linestyle = lineStyles[i],c = colors[i],label=str(model))#,c = CB_color_cycle[2*i+1])
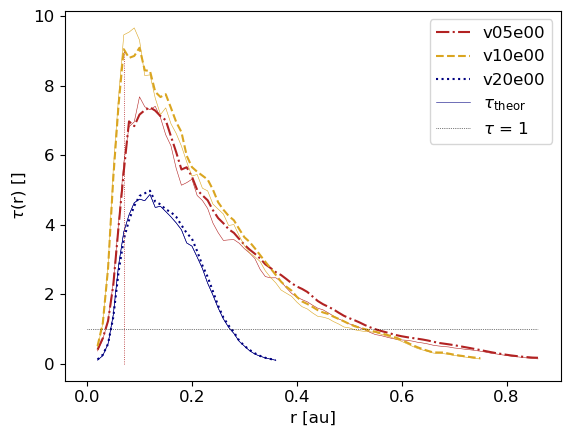
ax6.plot(r[1:],tau[1:],linestyle = lineStyles[i],c = colors[i],label=str(model))#,c = CB_color_cycle[2*i+1])
ax5.plot(r[1:],SigmaT[1:],linestyle = '-',linewidth = 0.4,c = colors[i])#,c = CB_color_cycle[2*i+1])
ax6.plot(r[1:],tauT[1:],linestyle = '-',linewidth = 0.4,c = colors[i])#,c = CB_color_cycle[2*i+1])
if model == 'v20e00':
ax5.plot(r[1:],SigmaT[1:],linestyle = '-',linewidth = 0.4,c = colors[i],label=r'$\Sigma_{\rm theor}$')#,c = CB_color_cycle[2*i+1])
ax6.plot(r[1:],tauT[1:],linestyle = '-',linewidth = 0.4,c = colors[i],label=r'$\tau_{\rm theor}$')#,c = CB_color_cycle[2*i+1])
maxXM = np.max(r[1:])
SHmaxi = np.append(SHmaxi,np.max(SH[1:]))
Mtmaxi = np.append(Mtmaxi,np.max(Mtot[1:]))
radii = np.append(radii ,np.max(r))
if maxXM > maxX:
maxX = maxXM
i = i+1
print('The radii are ',radii)
# Construct plots
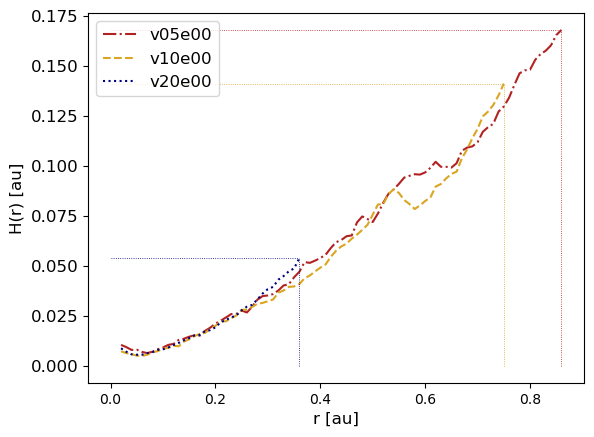
ax1.legend(fontsize = 12)
ax1.set_xlabel(r'r [au]',fontsize = 12)
ax1.set_ylabel(r'H(r) [au]',fontsize = 12,rotation = 90)
# ax1.set_ylabel(xH+r'(r) [au]',fontsize = 12,rotation = 90)
# ax1.tick_params(axis='x', labelsize=12)
ax1.tick_params(axis='y', labelsize=12)
ax1.hlines(y=SHmaxi,xmin=0,xmax=radii,linewidth = 0.6, color = colors,linestyle = ':')#,label='criterium')
ax1.vlines(x=radii,ymin = 0, ymax = SHmaxi, color = colors,linestyle = ':',linewidth=0.6)#, label ='r')
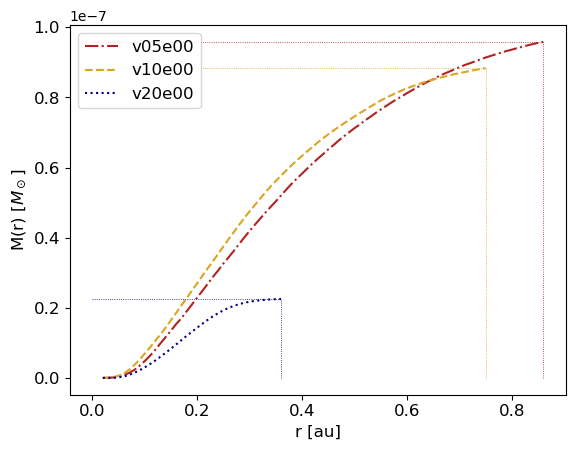
ax2.legend(fontsize = 12)
ax2.set_xlabel(r'r [au]',fontsize = 12)
ax2.set_ylabel(r'M(r) [$M_\odot$]',fontsize = 12,rotation = 90)
ax2.tick_params(axis='x', labelsize=12)
ax2.tick_params(axis='y', labelsize=12)
ax2.hlines(y=Mtmaxi,xmin=0,xmax=radii,linewidth = 0.6, color = colors,linestyle = ':')#,label='criterium')
ax2.vlines(x=radii,ymin = 0, ymax = Mtmaxi, color = colors,linestyle = ':',linewidth=0.6)#, label ='r')
ax3.legend(fontsize = 12)
ax3.set_xlabel(r'r [au]',fontsize = 12)
ax3.set_ylabel(r'Mrel/rstep []',fontsize = 12,rotation = 90)
ax3.tick_params(axis='x', labelsize=12)
ax3.tick_params(axis='y', labelsize=12)
crit = 0.3
ax3.hlines(y=crit,xmin=0,xmax=maxX,linewidth = 0.5, color = 'k',linestyle = 'dotted',label='criterium')
ax3.plot(radii[0],0,'*',color = colors[0])
ax3.plot(radii[1],0,'*',color = colors[1])
ax3.plot(radii[2],0,'*',color = colors[2])
ax4.legend(fontsize = 12)
ax4.set_xlabel(r'r [au]',fontsize = 12)
# ax4.set_ylabel(xH+r'(r)/r []',fontsize = 12,rotation = 90)
ax4.set_ylabel(r'H(r)/r []',fontsize = 12,rotation = 90)
ax4.tick_params(axis='x', labelsize=12)
ax4.tick_params(axis='y', labelsize=12)
ax4.vlines(x=0.07,ymin = 0, ymax = 0.5, color = colors,linestyle = ':',linewidth=0.6)#, label ='r')
if xH == '1H':
ax5.legend(fontsize = 12)
ax5.set_xlabel(r'r [au]',fontsize = 12)
ax5.set_ylabel(r'$\Sigma$(r) [g cm$^{-2}$]',fontsize = 12,rotation = 90)
ax5.tick_params(axis='x', labelsize=12)
ax5.tick_params(axis='y', labelsize=12)
ax6.set_xlabel(r'r [au]',fontsize = 12)
ax6.set_ylabel(r'$\tau$(r) []',fontsize = 12,rotation = 90)
ax6.tick_params(axis='x', labelsize=12)
ax6.tick_params(axis='y', labelsize=12)
ax6.hlines(y=1,xmin=0,xmax=maxX,linewidth = 0.5, color = 'k',linestyle = 'dotted',label=r'$\tau$ = 1')
ax6.legend(fontsize = 12)
ax6.vlines(x=0.07,ymin = 0, ymax = 9, color = colors,linestyle = ':',linewidth=0.6)#, label ='r')
fig1.savefig('/lhome/jolienm/Documents/TierModels/R_Aql/cooling/binariesInPaper/finalAccrDisks/plotsAnalysis/e00Models_SHvsR_wind_00'+str(dump)+'_'+xH+'.png')
fig2.savefig('/lhome/jolienm/Documents/TierModels/R_Aql/cooling/binariesInPaper/finalAccrDisks/plotsAnalysis/e00Models_MvsR_wind_00'+str(dump)+'_'+xH+'.png')
fig3.savefig('/lhome/jolienm/Documents/TierModels/R_Aql/cooling/binariesInPaper/finalAccrDisks/plotsAnalysis/e00Models_Mrel:rstep_wind_00'+str(dump)+'_'+xH+'.png')
fig4.savefig('/lhome/jolienm/Documents/TierModels/R_Aql/cooling/binariesInPaper/finalAccrDisks/plotsAnalysis/e00Models_SH:r_wind_00'+str(dump)+'_'+xH+'.png')
if xH == '1H':
fig5.savefig('/lhome/jolienm/Documents/TierModels/R_Aql/cooling/binariesInPaper/finalAccrDisks/plotsAnalysis/e00Models_Sigma_wind_00'+str(dump)+'_'+xH+'.png')
fig6.savefig('/lhome/jolienm/Documents/TierModels/R_Aql/cooling/binariesInPaper/finalAccrDisks/plotsAnalysis/e00Models_Tau_wind_00'+str(dump)+'_'+xH+'.png')
[4]:
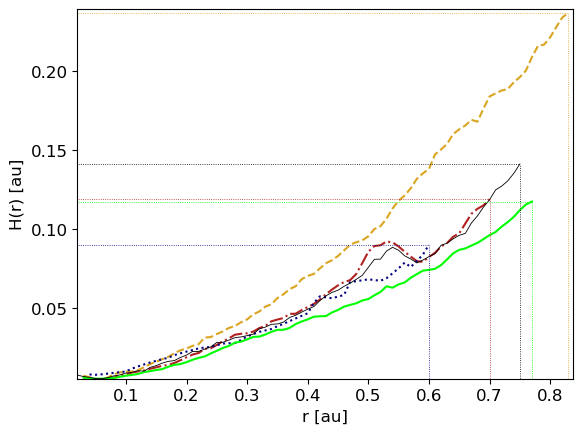
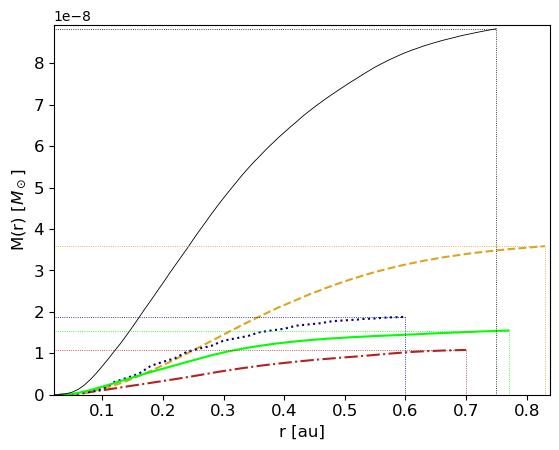
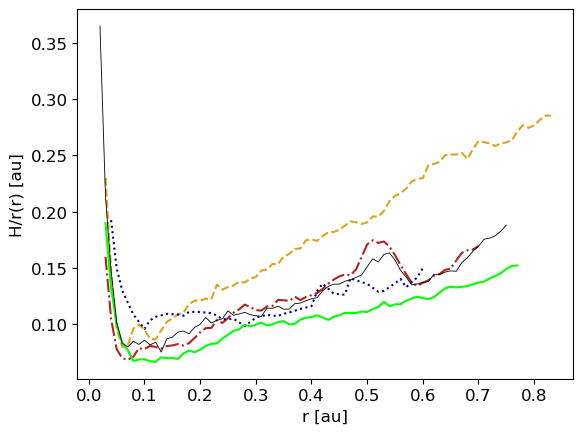
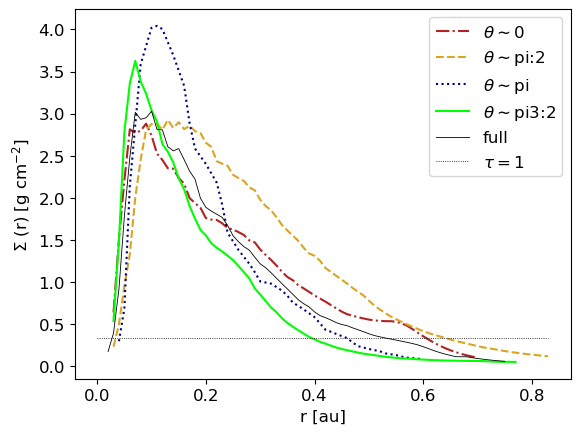
'''
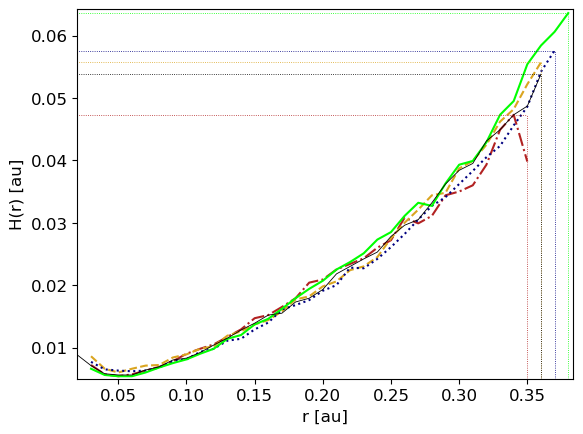
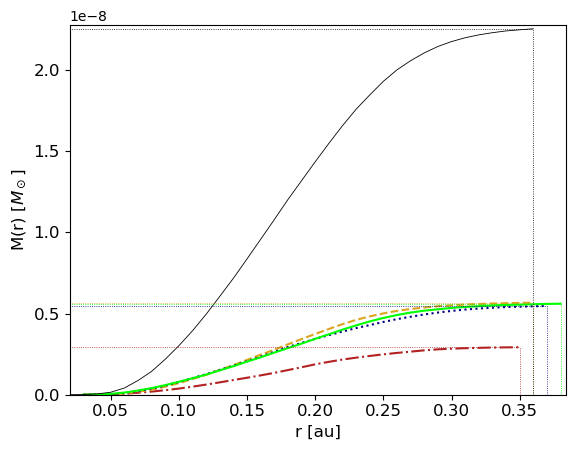
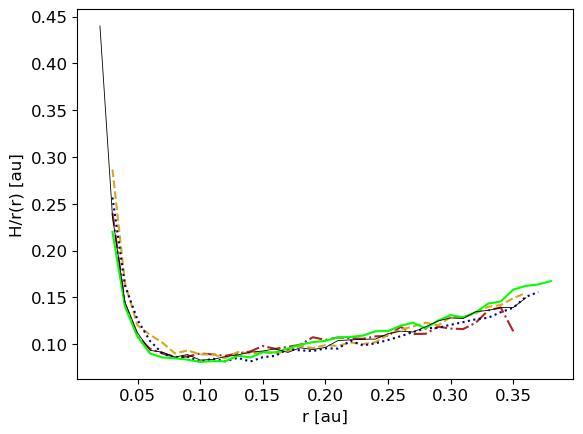
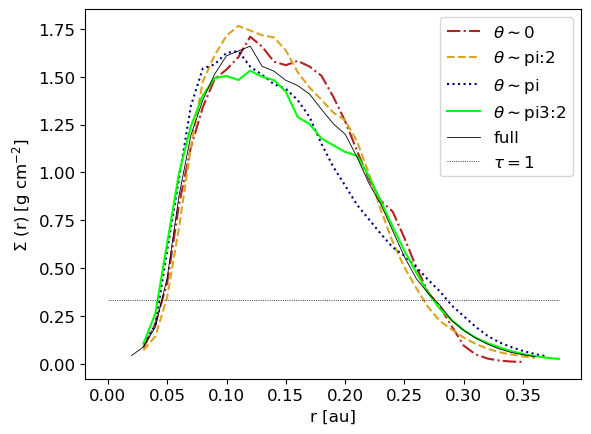
Plot of scale heights and total mass ifo r for 1 model, 1 dump, 4 thetaregions
'''
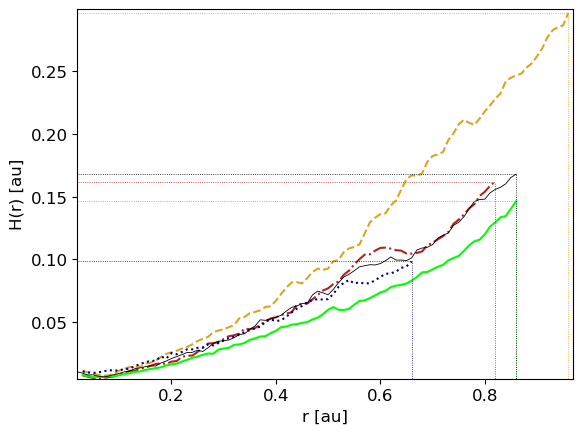
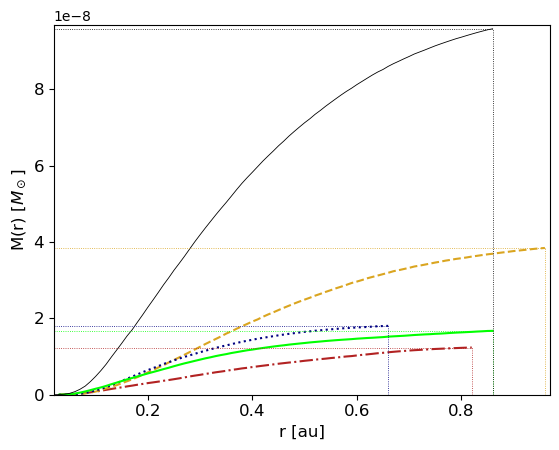
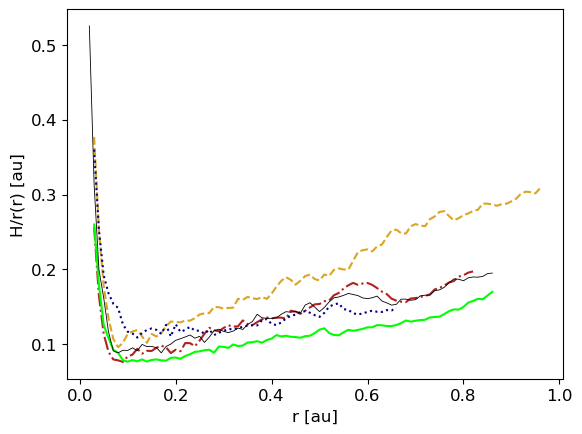
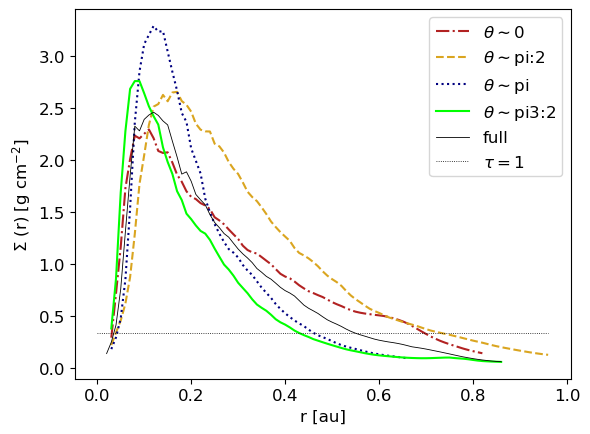
def plotHM_diffThetaRegions(dump,model,xH):
run = '/lhome/jolienm/Documents/TierModels/R_Aql/cooling/binariesInPaper/finalAccrDisks/'+str(model)+'_T3000_res8_racc01/'
thetas = ['0','pi:2','pi','pi3:2']
lineStyles = ['-.','--',':','-','-']
colors = ['firebrick','goldenrod','navy','lime','k']
fig1, ax1 = plt.subplots()
fig2, ax2 = plt.subplots()
fig4, ax4 = plt.subplots()
if xH == '1H':
fig3, ax3 = plt.subplots()
# if xH == '1H':
# fig, ((ax1),(ax2),(ax3)) = plt.subplots(nrows = 1, ncols= 3 , figsize=(30, 7))
# else:
# fig, ((ax1),(ax2)) = plt.subplots(nrows = 1, ncols= 2 , figsize=(20, 7))
# read files with data for r, scale height and mass for different theta regions
# safe maximal scale heights, radii and masses for plot
SHmaxi = []
radii = []
masses = []
i = 0
for theta in thetas:
file = os.path.join(run,'plotsAnalysis/infoAccrDisk_theta~'+str(theta)+'_wind_00'+str(dump)+'_'+xH+'.txt')
(r, SH, Mtot,Sigma) = np.loadtxt(file, skiprows=11, usecols=(0,1,2,4), unpack=True)
ax1.plot(r[1:],(SH[1:]),linestyle = lineStyles[i],color = colors[i],label=r'$\theta \sim$'+str(theta))#,c = CB_color_cycle[2*i+1])
ax2.plot(r[1:],(Mtot[1:]),linestyle = lineStyles[i],color = colors[i],label=r'$\theta \sim$'+str(theta))#,c = CB_color_cycle[2*i+1])
ax4.plot(r[1:],(SH[1:]/r[1:]),linestyle = lineStyles[i],color = colors[i],label=r'$\theta \sim$'+str(theta))#,c = CB_color_cycle[2*i+1])
if xH == '1H':
ax3.plot(r[1:],(Sigma[1:]),linestyle = lineStyles[i],color = colors[i],label=r'$\theta \sim$'+str(theta))#,c = CB_color_cycle[2*i+1])
SHmaxi = np.append(SHmaxi,np.max(SH))
radii = np.append(radii ,np.max(r))
masses = np.append(masses,np.max(Mtot))
i = i+1
# Same for full dump
(r,SH,RhoMax,Mtot,MrelRstep,Sigma,SigmaT,tau,tauT) = ad.readInfoAccrDisk(run,dump,xH)
SHmaxi = np.append(SHmaxi,np.max(SH))
radii = np.append(radii ,np.max(r))
masses = np.append(masses,np.max(Mtot))
# Make plots
ax1.plot(r[1:],(SH[1:]),linestyle = lineStyles[i],label='full',color = colors[i],linewidth = 0.6)#,c = CB_color_cycle[2*i+1])
ax1.hlines(y=SHmaxi,xmin=0,xmax=radii,linewidth = 0.6, color = colors,linestyle = ':')#,label='criterium')
ax1.vlines(x=radii,ymin = 0, ymax = SHmaxi, color = colors,linestyle = ':',linewidth=0.6)#, label ='r')
# ax1.legend(fontsize = 12)
ax1.set_xlabel(r'r [au]',fontsize = 12)
# ax1.set_ylabel(xH+r'(r) [au]',fontsize = 12,rotation = 90)
ax1.set_ylabel(r'H(r) [au]',fontsize = 12,rotation = 90)
ax1.tick_params(axis='x', labelsize=12)
ax1.tick_params(axis='y', labelsize=12)
ax1.set_xlim(0.02,1.01*np.max(radii))
ax1.set_ylim(0.005,1.01*np.max(SHmaxi))
ax2.plot(r[1:],(Mtot[1:]),linestyle = lineStyles[i],label='full',color = colors[i],linewidth = 0.6)#,c = CB_color_cycle[2*i+1])
ax2.hlines(y=masses,xmin=0,xmax=radii,linewidth = 0.6, color = colors,linestyle = ':')#,label='criterium')
ax2.vlines(x=radii,ymin = 0, ymax = masses, color = colors,linestyle = ':',linewidth=0.6)#, label ='r')
# ax2.legend(fontsize = 12)
ax2.set_xlabel(r'r [au]',fontsize = 12)
ax2.set_ylabel(r'M(r) [$M_\odot$]',fontsize = 12,rotation = 90)
ax2.tick_params(axis='x', labelsize=12)
ax2.tick_params(axis='y', labelsize=12)
ax2.set_xlim(0.02,1.01*np.max(radii))
ax2.set_ylim(0,1.01*np.max(masses))
if xH == '1H':
ax3.plot(r[1:],(Sigma[1:]),linestyle = lineStyles[i],label='full',color = colors[i],linewidth = 0.6)#,c = CB_color_cycle[2*i+1])
ax3.hlines(y=1./3.,xmin=0,xmax=np.max(radii),linewidth = 0.6, color = 'k',linestyle = ':',label=r'$\tau = 1$')
# ax3.vlines(x=radii,ymin = 0, ymax = masses, color = colors,linestyle = ':',linewidth=0.6)#, label ='r')
# ax3.legend(fontsize = 16)
ax3.legend(fontsize = 12)
ax3.set_xlabel(r'r [au]',fontsize = 12)
ax3.set_ylabel(r'$\Sigma$ (r) [g cm$^{-2}$]',fontsize = 12,rotation = 90)
ax3.tick_params(axis='x', labelsize=12)
ax3.tick_params(axis='y', labelsize=12)
ax4.plot(r[1:],(SH[1:]/r[1:]),linestyle = lineStyles[i],label='full',color = colors[i],linewidth = 0.6)#,c = CB_color_cycle[2*i+1])
# ax1.hlines(y=SHmaxi,xmin=0,xmax=radii,linewidth = 0.6, color = colors,linestyle = ':')#,label='criterium')
# ax1.vlines(x=radii,ymin = 0, ymax = SHmaxi, color = colors,linestyle = ':',linewidth=0.6)#, label ='r')
# ax1.legend(fontsize = 12)
ax4.set_xlabel(r'r [au]',fontsize = 12)
# ax4.set_ylabel(xH+r'/r(r) [au]',fontsize = 12,rotation = 90)
ax4.set_ylabel(r'H/r(r) [au]',fontsize = 12,rotation = 90)
ax4.tick_params(axis='x', labelsize=12)
ax4.tick_params(axis='y', labelsize=12)
# ax1.set_xlim(0.02,1.01*np.max(radii))
# ax1.set_ylim(0.005,1.01*np.max(SHmaxi))
# fig.savefig(run+'/plotsAnalysis/diffThetas_SH_M_Sigma_R_wind_00'+str(dump)+'_'+xH+'.png')
fig1.savefig(run+'/plotsAnalysis/diffTh_SH_r_wind_00'+str(dump)+'_'+xH+'.png')
fig2.savefig(run+'/plotsAnalysis/diffTh_M_r_wind_00'+str(dump)+'_'+xH+'.png')
if xH == '1H':
fig3.savefig(run+'/plotsAnalysis/diffTh_Sigma_r_wind_00'+str(dump)+'_'+xH+'.png')
fig4.savefig(run+'/plotsAnalysis/diffTh_SH:r_wind_00'+str(dump)+'_'+xH+'.png')
EXAMPLES (all my models, all options):
[37]:
'''
Plot of scale heights and total mass ifo r for 1 model, different dumps
'''
xH    = '1H'
model = 'v20e50'
dumps = [250,266,277,292]
plotHM_diffDumps(model,dumps,xH)
model = 'v10e50'
dumps = [245,263,277,292]
plotHM_diffDumps(model,dumps,xH)
model = 'v05e50'
dumps = [245,263,277,292]
plotHM_diffDumps(model,dumps,xH)
xH    = '2H'
model = 'v20e50'
dumps = [250,266,277,292]
plotHM_diffDumps(model,dumps,xH)
model = 'v10e50'
dumps = [245,263,277,292]
plotHM_diffDumps(model,dumps,xH)
model = 'v05e50'
dumps = [245,263,277,292]
plotHM_diffDumps(model,dumps,xH)
/tmp/ipykernel_21492/1999450277.py:6: RuntimeWarning: More than 20 figures have been opened. Figures created through the pyplot interface (`matplotlib.pyplot.figure`) are retained until explicitly closed and may consume too much memory. (To control this warning, see the rcParam `figure.max_open_warning`). Consider using `matplotlib.pyplot.close()`.
  fig1, ax1 = plt.subplots()


[13]:
xH    = '1H'
model = 'v20e00'
dumps = [120,270,284,292,300]
plotHM_diffDumps(model,dumps,xH)
[23]:
'''
Plot of scale heights, total mass and relative added mass ifo r for 3 different models, same dump
'''
modelNames = ['v05e00','v10e00','v20e00']
dump = 292
xH   = '2H'
# plotHMrM_3models(modelNames,dump,xH)
xH   = '1H'
plotHMrM_3models(modelNames,dump,xH)
The radii are [0.86 0.75 0.36]
[29]:
'''
Plot of scale heights and total mass ifo r for 1 model, 1 dump, 4 thetaregions
'''
dump = 292
xH = '1H'
model = 'v20e00'
plotHM_diffThetaRegions(dump,model,xH)
model = 'v10e00'
plotHM_diffThetaRegions(dump,model,xH)
model = 'v05e00'
plotHM_diffThetaRegions(dump,model,xH)
# xH = '2H'
# model = 'v20e00'
# plotHM_diffThetaRegions(dump,model,xH)
# model = 'v10e00'
# plotHM_diffThetaRegions(dump,model,xH)
# model = 'v05e00'
# plotHM_diffThetaRegions(dump,model,xH)
[ ]: