Construct plots of the scale height, radius and mass estimate of an accretion disk using plons
This script should be used only after running the accrDisks_calcHRM_Plons.ipynb notebook for several models, or several dumps, that you aim to compare
Importing packages
[1]:
import plons
import os
import numpy as np
import matplotlib.pyplot        as plt

import plons.ConversionFactors_cgs        as cgs
import plons.AccrDisk                     as ad
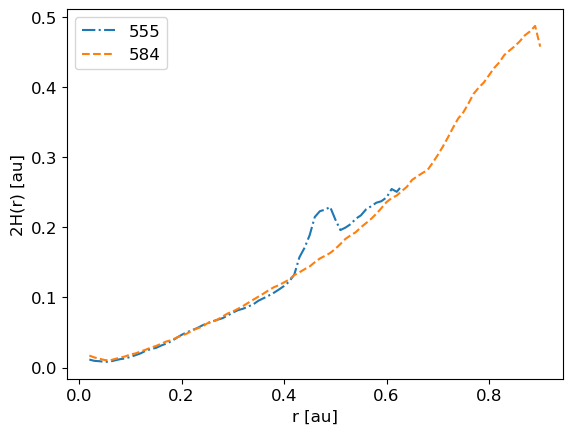
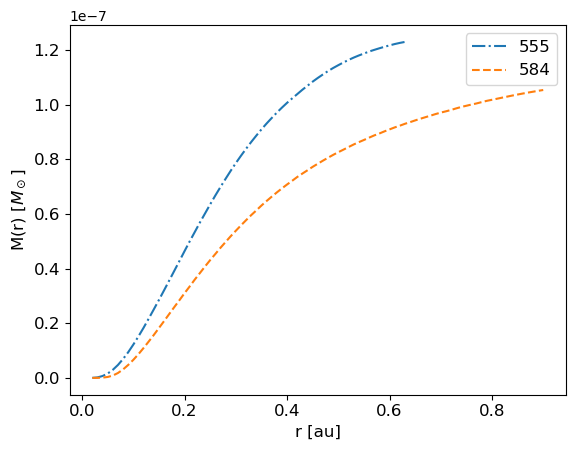
Compare the scale height and mass in function of radius for different dumps within 1 simulation, e.g. within one orbital period of an eccentric orbit
[2]:
'''
Plot of scale heights and total mass ifo r for 1 model, different dumps
'''
def plotHM_diffDumps(run,dumps,xH):
    fig1, ax1 = plt.subplots()
    fig2, ax2 = plt.subplots()
    if xH == '1H':
        fig3, ax3 = plt.subplots()
        fig4, ax4 = plt.subplots()
        fig5, ax5 = plt.subplots()
    lineStyles = ['-.','--','-',':']
    i = 0
    for dump in dumps:
        # For all dumps, read in info about r, scale heights, mass
        (r,SH,RhoMax,Mtot,MrelRstep,Sigma,SigmaT,tau,tauT) = ad.readInfoAccrDisk(run,dump,xH)
        ax1.plot(r[1:],(SH[1:]),linestyle = lineStyles[i],label=str(dump))#,c = CB_color_cycle[2*i+1])
        ax2.plot(r[1:],(Mtot[1:]),linestyle = lineStyles[i],label=str(dump))#,c = CB_color_cycle[2*i+1])
        if xH == '1H':
            ax3.plot(r[1:],(Sigma[1:]),linestyle = lineStyles[i],label=str(dump))#,c = CB_color_cycle[2*i+1])
            ax4.plot(r[1:],(tau[1:]),linestyle = lineStyles[i],label=str(dump))#,c = CB_color_cycle[2*i+1])
            ax5.plot(r[1:],RhoMax[1:],linestyle = lineStyles[i],label=str(dump))
        i = i+1

    # Construct plots
    ax1.legend(fontsize = 12)
    ax1.set_xlabel(r'r [au]',fontsize = 12)
    ax1.set_ylabel(xH+r'(r) [au]',fontsize = 12,rotation = 90)
    ax1.tick_params(axis='x', labelsize=12)
    ax1.tick_params(axis='y', labelsize=12)

    ax2.legend(fontsize = 12)
    ax2.set_xlabel(r'r [au]',fontsize = 12)
    ax2.set_ylabel(r'M(r) [$M_\odot$]',fontsize = 12,rotation = 90)
    ax2.tick_params(axis='x', labelsize=12)
    ax2.tick_params(axis='y', labelsize=12)

    fig1.savefig(run+'/plotsAnalysis/diffDumps_SHvsR_'+xH+'.png')
    fig2.savefig(run+'/plotsAnalysis/diffDumps_MvsR_'+xH+'.png')

    if xH == '1H':
        ax3.legend(fontsize = 12)
        ax3.set_xlabel(r'r [au]',fontsize = 12)
        ax3.set_ylabel(r'$\Sigma$(r) [g cm$^{-2}$]',fontsize = 12,rotation = 90)
        ax3.tick_params(axis='x', labelsize=12)
        ax3.tick_params(axis='y', labelsize=12)

        ax4.legend(fontsize = 12)
        ax4.set_xlabel(r'r [au]',fontsize = 12)
        ax4.set_ylabel(r'$\tau$(r) []',fontsize = 12,rotation = 90)
        ax4.tick_params(axis='x', labelsize=12)
        ax4.tick_params(axis='y', labelsize=12)

        ax5.legend(fontsize = 12)
        ax5.set_xlabel(r'r [au]',fontsize = 12)
        ax5.set_ylabel(r'$\rho$(r) [g cm$^{-3}$]',fontsize = 12,rotation = 90)
        ax5.tick_params(axis='x', labelsize=12)
        ax5.tick_params(axis='y', labelsize=12)

        fig3.savefig(run+'/plotsAnalysis/diffDumps_SigmavsR_'+xH+'.png')
        fig4.savefig(run+'/plotsAnalysis/diffDumps_TauvsR_'+xH+'.png')
        fig5.savefig(run+'/plotsAnalysis/diffDumps_RhoMaxvsR_'+xH+'.png')
[3]:
model  = 'v10e50_AD'
run    = '/lhome/jolienm/Documents/TierModels/PlonsExampleModels/'+str(model)+'/'
dumps  = [555,584]
plotHM_diffDumps(run,dumps,'2H')
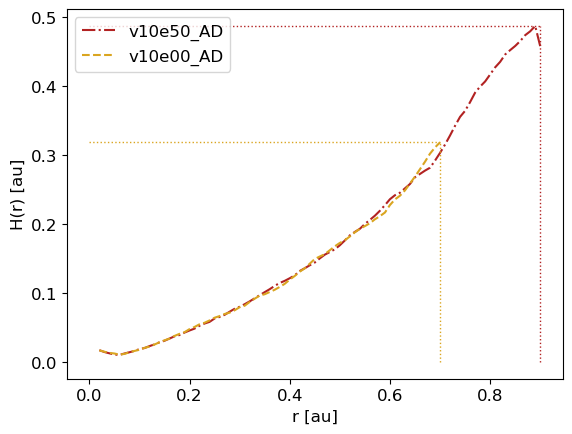
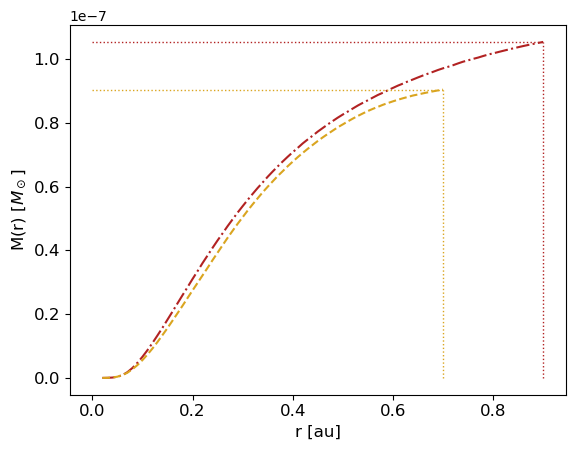
Compare the scale height and mass in function of radius for (3) different simulations, but same timestep dump
[19]:
'''
Plot of scale heights, total mass and relative added mass ifo r for 3 different models, same dump
'''
def plotHMrM_Diffmodels(modelNames,loc,dump,xH):
fig1, ax1 = plt.subplots()
fig2, ax2 = plt.subplots()
fig3, ax3 = plt.subplots()
fig4, ax4 = plt.subplots()
if xH == '1H':
fig5, ax5 = plt.subplots()
fig6, ax6 = plt.subplots()
fig7, ax7 = plt.subplots()
lineStyles = ['-.','--',':','-','-']
SHmaxi = []
Mtmaxi = []
radii = []
colors = ['firebrick','goldenrod','navy']
i = 0
maxX = 0
# Read in info about r, scale heights, masses and relative added mas
for model in modelNames:
run = str(loc)+str(model)
(r,SH,RhoMax,Mtot,MrelRstep,Sigma,SigmaT,tau,tauT) = ad.readInfoAccrDisk(run,dump,xH)
ax1.plot(r[1:],(SH[1:]),linestyle = lineStyles[i],c = colors[i],label=str(model))#,c = CB_color_cycle[2*i+1])
ax2.plot(r[1:],(Mtot[1:]),linestyle = lineStyles[i],c = colors[i], label=str(model))#,c = CB_color_cycle[2*i+1])
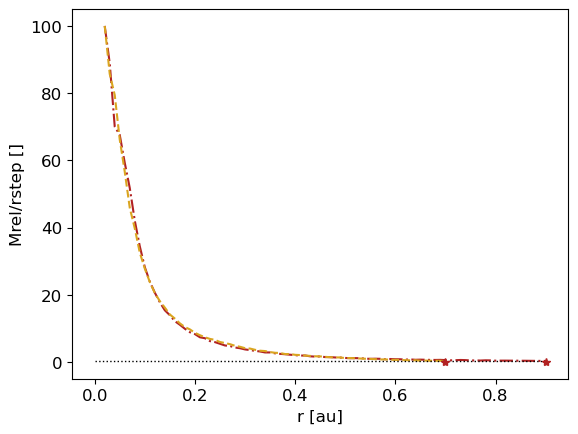
ax3.plot(r[1:],(MrelRstep[1:]),linestyle = lineStyles[i],c = colors[i], label=str(model))#,c = CB_color_cycle[2*i+1])
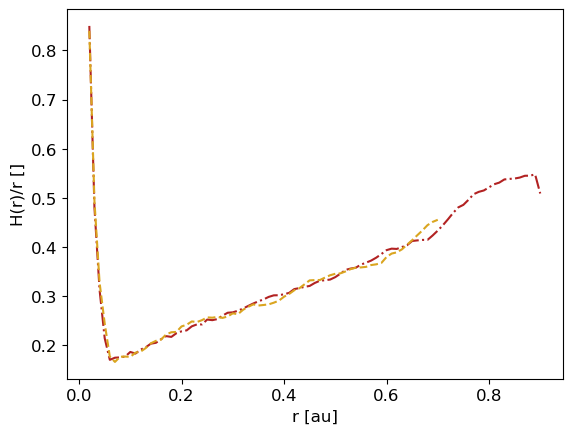
ax4.plot(r[1:],(SH[1:]/r[1:]),linestyle = lineStyles[i],c = colors[i],label=str(model))#,c = CB_color_cycle[2*i+1])
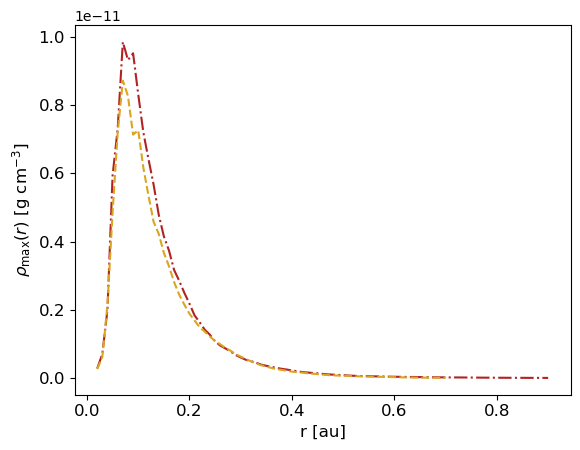
ax7.plot(r[1:],RhoMax[1:],linestyle = lineStyles[i],c = colors[i],label=str(model))
if xH == '1H':
ax5.plot(r[1:],Sigma[1:],linestyle = lineStyles[i],c = colors[i], label=str(model))
ax6.plot(r[1:],tau[1:],linestyle = lineStyles[i],c = colors[i], label=str(model))
maxXM = np.max(r[1:])
SHmaxi = np.append(SHmaxi,np.max(SH[1:]))
Mtmaxi = np.append(Mtmaxi,np.max(Mtot[1:]))
radii = np.append(radii ,np.max(r))
if maxXM > maxX:
maxX = maxXM
i = i+1
print('The radii are ',radii)
# Construct plots
ax1.legend(fontsize = 12)
ax1.set_xlabel(r'r [au]',fontsize = 12)
ax1.set_ylabel(r'H(r) [au]',fontsize = 12,rotation = 90)
# ax1.set_ylabel(xH+r'(r) [au]',fontsize = 12,rotation = 90)
ax1.tick_params(axis='x', labelsize=12)
ax1.tick_params(axis='y', labelsize=12)
ax1.hlines(y=SHmaxi,xmin=0,xmax=radii,linewidth = 1, color = colors,linestyle = ':')#,label='criterium')
ax1.vlines(x=radii,ymin = 0, ymax = SHmaxi, color = colors,linestyle = ':',linewidth= 1.0)#, label ='r')
# ax2.legend(fontsize = 12)
ax2.set_xlabel(r'r [au]',fontsize = 12)
ax2.set_ylabel(r'M(r) [$M_\odot$]',fontsize = 12,rotation = 90)
ax2.tick_params(axis='x', labelsize=12)
ax2.tick_params(axis='y', labelsize=12)
ax2.hlines(y=Mtmaxi,xmin=0,xmax=radii,linewidth = 1, color = colors,linestyle = ':')#,label='criterium')
ax2.vlines(x=radii,ymin = 0, ymax = Mtmaxi, color = colors,linestyle = ':',linewidth= 1.0)#, label ='r')
# ax3.legend(fontsize = 12)
ax3.set_xlabel(r'r [au]',fontsize = 12)
ax3.set_ylabel(r'Mrel/rstep []',fontsize = 12,rotation = 90)
ax3.tick_params(axis='x', labelsize=12)
ax3.tick_params(axis='y', labelsize=12)
crit = 0.3
ax3.hlines(y=crit,xmin=0,xmax=maxX,linewidth = 1.0, color = 'k',linestyle = 'dotted',label='criterium')
for i in range(0,len(radii)):
ax3.plot(radii[i],0,'*',color = colors[0])
# ax3.plot(radii[1],0,'*',color = colors[1])
# ax3.plot(radii[2],0,'*',color = colors[2])
# ax4.legend(fontsize = 12)
ax4.set_xlabel(r'r [au]',fontsize = 12)
# ax4.set_ylabel(xH+r'(r)/r []',fontsize = 12,rotation = 90)
ax4.set_ylabel(r'H(r)/r []',fontsize = 12,rotation = 90)
ax4.tick_params(axis='x', labelsize=12)
ax4.tick_params(axis='y', labelsize=12)
# ax4.vlines(x=0.07,ymin = 0, ymax = 0.5, color = colors,linestyle = ':',linewidth= 1.0)#, label ='r')
if xH == '1H':
# ax5.legend(fontsize = 12)
ax5.set_xlabel(r'r [au]',fontsize = 12)
ax5.set_ylabel(r'$\Sigma$(r) [g cm$^{-2}$]',fontsize = 12,rotation = 90)
ax5.tick_params(axis='x', labelsize=12)
ax5.tick_params(axis='y', labelsize=12)
ax6.set_xlabel(r'r [au]',fontsize = 12)
ax6.set_ylabel(r'$\tau$(r) []',fontsize = 12,rotation = 90)
ax6.tick_params(axis='x', labelsize=12)
ax6.tick_params(axis='y', labelsize=12)
ax6.hlines(y=1,xmin=0,xmax=maxX,linewidth = 1.0, color = 'k',linestyle = 'dotted',label=r'$\tau$ = 1')
ax6.legend(fontsize = 12)
# ax6.vlines(x=0.07,ymin = 0, ymax = 9, color = colors,linestyle = ':',linewidth= 1.0)#, label ='r')
ax7.set_xlabel(r'r [au]',fontsize = 12)
# ax4.set_ylabel(xH+r'(r)/r []',fontsize = 12,rotation = 90)
ax7.set_ylabel(r'$\rho_{\rm max}(r)$ [g cm$^{-3}$]',fontsize = 12,rotation = 90)
ax7.tick_params(axis='x', labelsize=12)
ax7.tick_params(axis='y', labelsize=12)
# ax4.vlines(x=0.07,ymin = 0, ymax = 0.5, color = colors,linestyle = ':',linewidth= 1.0)#, label ='r')
fig1.savefig('/lhome/jolienm/Documents/TierModels/finalModelsAccrDisks/plotsAnalysis/e00Models_SHvsR_wind_00'+str(dump)+'_'+xH+'.png')
fig2.savefig('/lhome/jolienm/Documents/TierModels/finalModelsAccrDisks/plotsAnalysis/e00Models_MvsR_wind_00'+str(dump)+'_'+xH+'.png')
fig3.savefig('/lhome/jolienm/Documents/TierModels/finalModelsAccrDisks/plotsAnalysis/e00Models_Mrel:rstep_wind_00'+str(dump)+'_'+xH+'.png')
fig4.savefig('/lhome/jolienm/Documents/TierModels/finalModelsAccrDisks/plotsAnalysis/e00Models_SH:r_wind_00'+str(dump)+'_'+xH+'.png')
if xH == '1H':
fig5.savefig('/lhome/jolienm/Documents/TierModels/finalModelsAccrDisks/plotsAnalysis/e00Models_Sigma_wind_00'+str(dump)+'_'+xH+'.png')
fig6.savefig('/lhome/jolienm/Documents/TierModels/finalModelsAccrDisks/plotsAnalysis/e00Models_Tau_wind_00'+str(dump)+'_'+xH+'.png')
fig7.savefig('/lhome/jolienm/Documents/TierModels/finalModelsAccrDisks/plotsAnalysis/e00Models_RhoMax_wind_00'+str(dump)+'_'+xH+'.png')
[20]:
modelNames  = ['v10e50_AD','v10e00_AD']
dump   = 584
loc    = '/lhome/jolienm/Documents/TierModels/PlonsExampleModels/'
plotHMrM_Diffmodels(modelNames,loc,dump,'2H')
The radii are [0.9 0.7]
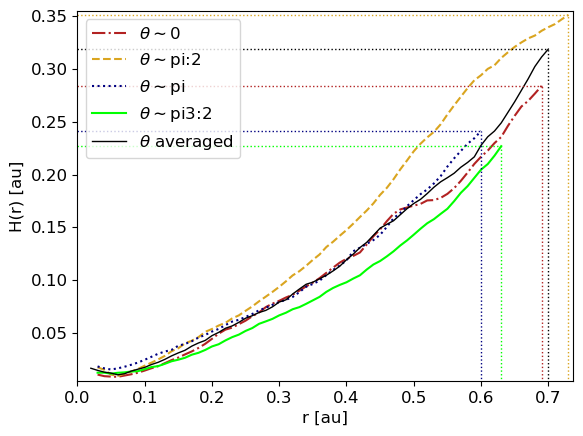
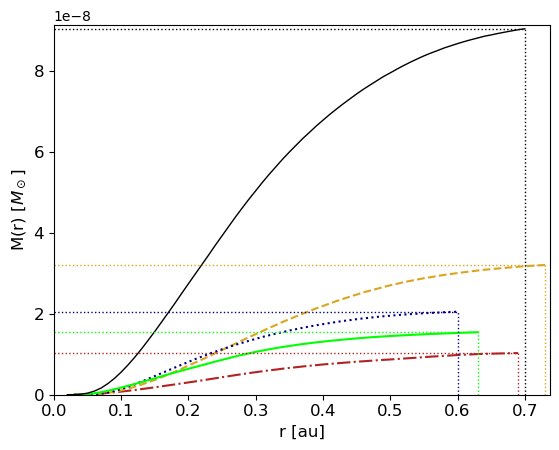
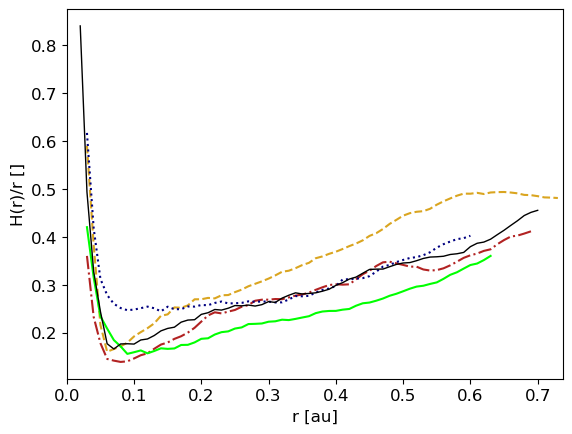
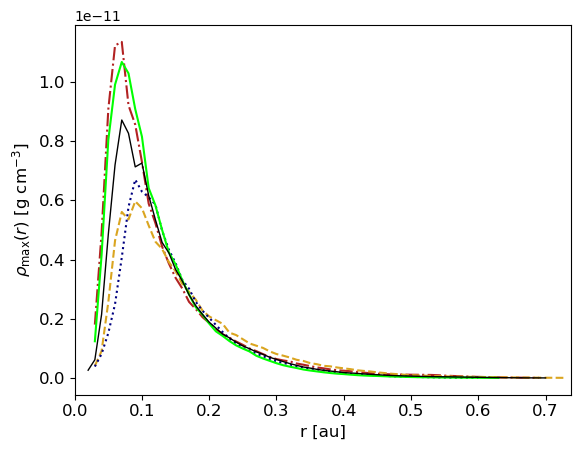
Compare the scale height and mass in function of radius for one simulation, one dump, but different theta quadrants
[8]:
'''
Plot of scale heights and total mass ifo r for 1 model, 1 dump, 4 thetaregions
'''
def plotHM_diffThetaRegions(dump,run,xH):
    thetas = ['0','pi:2','pi','pi3:2']
    lineStyles = ['-.','--',':','-','-']
    colors = ['firebrick','goldenrod','navy','lime','k']

    fig1, ax1 = plt.subplots()
    fig2, ax2 = plt.subplots()
    fig4, ax4 = plt.subplots()
    fig5, ax5 = plt.subplots()
    if xH == '1H':
        fig3, ax3 = plt.subplots()

    # read files with data for r, scale height and mass for different theta regions
    # safe maximal scale heights, radii and masses for plot
    SHmaxi = []
    radii  = []
    masses = []
    i = 0
    for theta in thetas:
        file = os.path.join(run,'plotsAnalysis/infoAccrDisk_theta~'+str(theta)+'_wind_00'+str(dump)+'_'+xH+'.txt')
        (r, SH,RhoMax, Mtot,MrelRstep,Sigma,SigmaT,tau,tauT) = np.loadtxt(file, skiprows=11, usecols=(0,1,2,3,4,5,6,7,8), unpack=True)

        ax1.plot(r[1:],(SH[1:]),linestyle = lineStyles[i],color = colors[i],label=r'$\theta \sim$'+str(theta))#,c = CB_color_cycle[2*i+1])
        ax2.plot(r[1:],(Mtot[1:]),linestyle = lineStyles[i],color = colors[i],label=r'$\theta \sim$'+str(theta))#,c = CB_color_cycle[2*i+1])
        ax4.plot(r[1:],(SH[1:]/r[1:]),linestyle = lineStyles[i],color = colors[i],label=r'$\theta \sim$'+str(theta))#,c = CB_color_cycle[2*i+1])
        ax5.plot(r[1:],RhoMax[1:],linestyle = lineStyles[i],color = colors[i],label=r'$\theta \sim$'+str(theta))
        if xH == '1H':
            ax3.plot(r[1:],(Sigma[1:]),linestyle = lineStyles[i],color = colors[i],label=r'$\theta \sim$'+str(theta))#,c = CB_color_cycle[2*i+1])
        SHmaxi = np.append(SHmaxi,np.max(SH))
        radii  = np.append(radii ,np.max(r))
        masses = np.append(masses,np.max(Mtot))
        i = i+1

    # Same for full dump
    (r,SH,RhoMax,Mtot,MrelRstep,Sigma,SigmaT,tau,tauT) = ad.readInfoAccrDisk(run,dump,xH)
    SHmaxi = np.append(SHmaxi,np.max(SH))
    radii  = np.append(radii ,np.max(r))
    masses = np.append(masses,np.max(Mtot))

    # Make plots
    ax1.plot(r[1:],SH[1:],linestyle = lineStyles[i],label=r'$\theta$ averaged',color = colors[i],linewidth = 1)#,c = CB_color_cycle[2*i+1])
    ax1.hlines(y=SHmaxi,xmin=0,xmax=radii,linewidth = 1, color = colors,linestyle = ':')#,label='criterium')
    ax1.vlines(x=radii,ymin = 0, ymax = SHmaxi, color = colors,linestyle = ':',linewidth= 1.0)#, label ='r')
    ax1.legend(fontsize = 12)
    ax1.set_xlabel(r'r [au]',fontsize = 12)
    # ax1.set_ylabel(xH+r'(r) [au]',fontsize = 12,rotation = 90)
    ax1.set_ylabel(r'H(r) [au]',fontsize = 12,rotation = 90)
    ax1.tick_params(axis='x', labelsize=12)
    ax1.tick_params(axis='y', labelsize=12)
    ax1.set_xlim(0.02,1.01*np.max(radii))
    ax1.set_ylim(0.005,1.01*np.max(SHmaxi))

    ax2.plot(r[1:],(Mtot[1:]),linestyle = lineStyles[i],label='full',color = colors[i],linewidth = 1)#,c = CB_color_cycle[2*i+1])
    ax2.hlines(y=masses,xmin=0,xmax=radii,linewidth = 1, color = colors,linestyle = ':')#,label='criterium')
    ax2.vlines(x=radii,ymin = 0, ymax = masses, color = colors,linestyle = ':',linewidth= 1.0)#, label ='r')
    # ax2.legend(fontsize = 12)
    ax2.set_xlabel(r'r [au]',fontsize = 12)
    ax2.set_ylabel(r'M(r) [$M_\odot$]',fontsize = 12,rotation = 90)
    ax2.tick_params(axis='x', labelsize=12)
    ax2.tick_params(axis='y', labelsize=12)
    ax2.set_xlim(0.02,1.01*np.max(radii))
    ax2.set_ylim(0,1.01*np.max(masses))

    if xH == '1H':
        ax3.plot(r[1:],(Sigma[1:]),linestyle = lineStyles[i],label=r'$\theta$ averaged',color = colors[i],linewidth = 1)#,c = CB_color_cycle[2*i+1])
        ax3.hlines(y=1./3.,xmin=0,xmax=np.max(radii),linewidth = 1, color = 'k',linestyle = ':',label=r'$\tau = 1$')
        # ax3.vlines(x=radii,ymin = 0, ymax = masses, color = colors,linestyle = ':',linewidth= 1.0)#, label ='r')
        # ax3.legend(fontsize = 16)
        ax3.legend(fontsize = 12)
        ax3.set_xlabel(r'r [au]',fontsize = 12)
        ax3.set_ylabel(r'$\Sigma$ (r) [g cm$^{-2}$]',fontsize = 12,rotation = 90)
        ax3.tick_params(axis='x', labelsize=12)
        ax3.tick_params(axis='y', labelsize=12)


    ax4.plot(r[1:],(SH[1:]/r[1:]),linestyle = lineStyles[i],label=r'$\theta$ averaged',color = colors[i],linewidth = 1)#,c = CB_color_cycle[2*i+1])
    # ax1.hlines(y=SHmaxi,xmin=0,xmax=radii,linewidth = 1, color = colors,linestyle = ':')#,label='criterium')
    # ax1.vlines(x=radii,ymin = 0, ymax = SHmaxi, color = colors,linestyle = ':',linewidth= 1.0)#, label ='r')
    # ax1.legend(fontsize = 12)
    ax4.set_xlabel(r'r [au]',fontsize = 12)
    # ax4.set_ylabel(xH+r'/r(r) [au]',fontsize = 12,rotation = 90)
    ax4.set_ylabel(r'H(r)/r []',fontsize = 12,rotation = 90)
    ax4.tick_params(axis='x', labelsize=12)
    ax4.tick_params(axis='y', labelsize=12)
    # ax1.set_xlim(0.02,1.01*np.max(radii))
    # ax1.set_ylim(0.005,1.01*np.max(SHmaxi))


    ax5.plot(r[1:],RhoMax[1:],linestyle = lineStyles[i],label=r'$\theta$ averaged',color = colors[i],linewidth = 1)#,c = CB_color_cycle[2*i+1])
    ax5.set_xlabel(r'r [au]',fontsize = 12)
    ax5.set_ylabel(r'$\rho_{\rm max}(r)$ [g cm$^{-3}$]',fontsize = 12,rotation = 90)
    ax5.tick_params(axis='x', labelsize=12)
    ax5.tick_params(axis='y', labelsize=12)


    ax1.set_xlim(0,1.01*np.max(radii))
    ax2.set_xlim(0,1.01*np.max(radii))
    if xH == '1H':
        ax3.set_xlim(0,1.01*np.max(radii))
    ax4.set_xlim(0,1.01*np.max(radii))
    ax5.set_xlim(0,1.01*np.max(radii))


    # fig.savefig(run+'/plotsAnalysis/diffThetas_SH_M_Sigma_R_wind_00'+str(dump)+'_'+xH+'.png')
    fig1.savefig(run+'/plotsAnalysis/diffTh_SH_r_wind_00'+str(dump)+'_'+xH+'.png')
    fig2.savefig(run+'/plotsAnalysis/diffTh_M_r_wind_00'+str(dump)+'_'+xH+'.png')
    if xH == '1H':
        fig3.savefig(run+'/plotsAnalysis/diffTh_Sigma_r_wind_00'+str(dump)+'_'+xH+'.png')
    fig4.savefig(run+'/plotsAnalysis/diffTh_SH:r_wind_00'+str(dump)+'_'+xH+'.png')
    fig5.savefig(run+'/plotsAnalysis/diffTh_rhoMax_wind_00'+str(dump)+'_'+xH+'.png')
[11]:
model  = 'v10e00_AD'
run    = '/lhome/jolienm/Documents/TierModels/PlonsExampleModels/'+str(model)+'/'
dump   = 584
plotHM_diffThetaRegions(dump,run,'2H')