[2]:
%load_ext autoreload
%autoreload 2
Construct plots of density distribution, and the radial and tangential velocity profile within and around the disk, using Plons
Importing packages
[3]:
import math                     as math
import matplotlib.pyplot        as plt

# import necessary plons scripts
import plons.AccrDisk                     as ad
import os
Construct a plot of the density - radial vel - tangential velocity next to each other
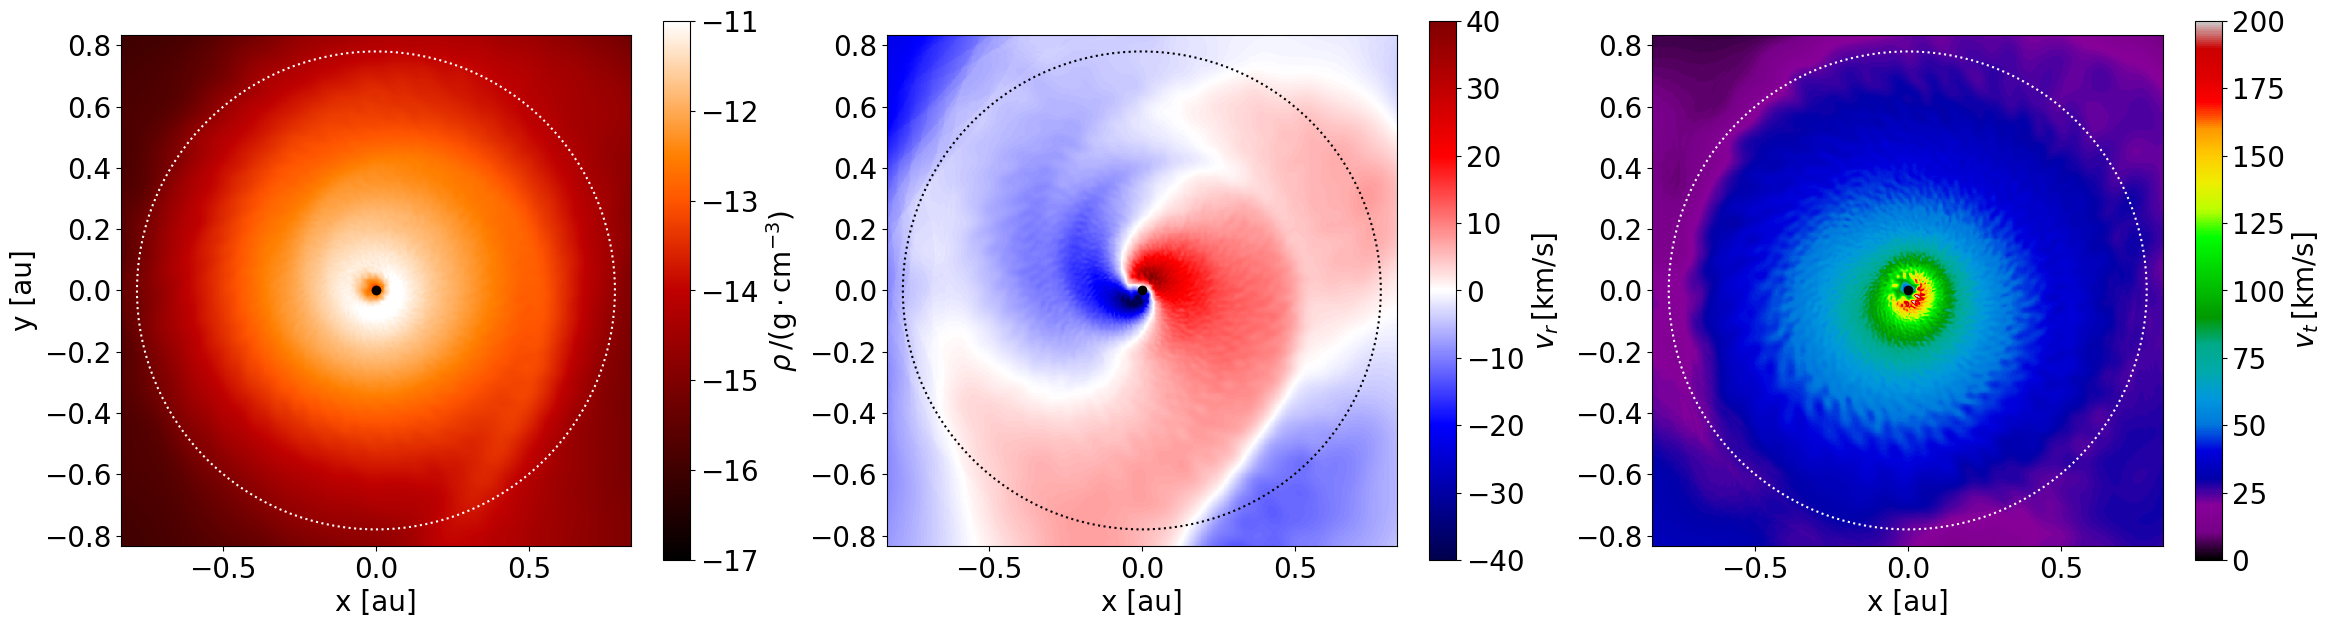
[8]:
# GET THE DATA IN THE SLICEPLOTS
model  = 'v10e00_AD'
run    = '/lhome/jolienm/Documents/TierModels/PlonsExampleModels/'+str(model)+'/'
dump   = 584
dumpData,setup = ad.loadDataForSmoothing(run,dump)
# fill in how much you want to zoom in
zoom   = 17
smooth = ad.calcSmoothVtVrRho(zoom,dumpData,setup)
Orbital phase is [1.999] pi
[14]:
# MAKE THE PLOT
fig, axs = plt.subplots(nrows = 1, ncols= 3 , figsize=(28, 7))
# you can optionally add limits for the density plot and draw a circle with the estimated radius of the disk
limitsRho = [-16,-10]
r      = 0.7
# ad.plot_vrvtRho(axs,smooth,zoom,r,limitsRho)  #r and limitsRho are optional arguments
# ad.plot_vrvtRho(axs,smooth,zoom,limitsRho = limitsRho)
ad.plot_vrvtRho(axs,smooth,zoom,r)

fig.savefig(run+f'plotsAnalysis/vrvtRho_op_wind_%05d'%(dump)+'_Z'+str(zoom)+'.png')
plt.show(fig)
Other possibilities:
The AccrDisk.py source file also contains functions to only plot 2 out of the 3 figures (plot_vrvr(), and plot_vrRho)